elcomponent.co.uk
Energy monitoring specialists
TEL: 01279 503173
aM&T Software
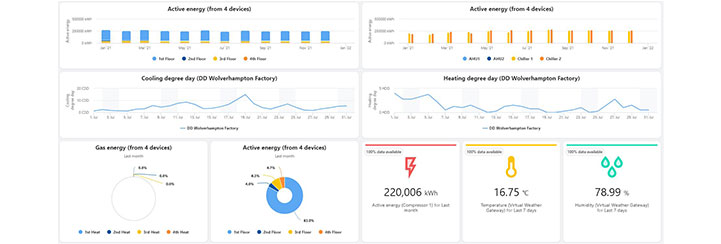
Dashboards & Displays
Quick and easy data display for engagement. Unlimited dashboards and users.
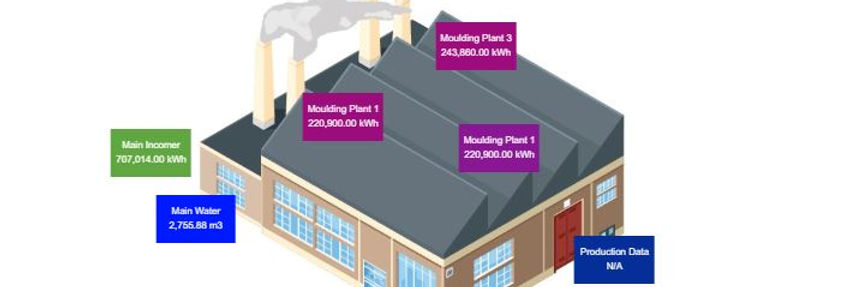
Graphics
Overlay dashboard data on to graphics for more visual dashboards.
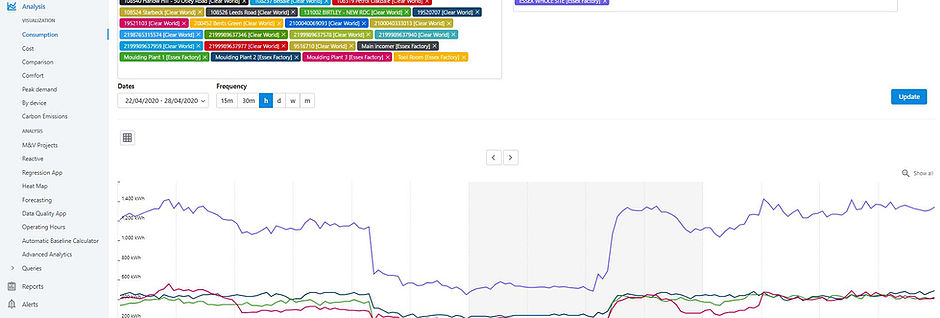
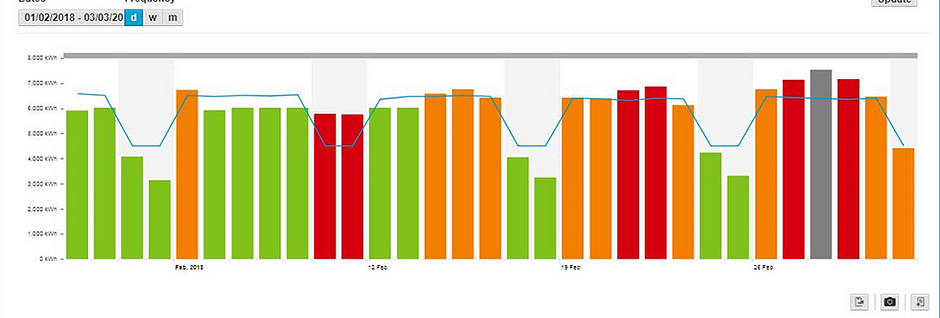
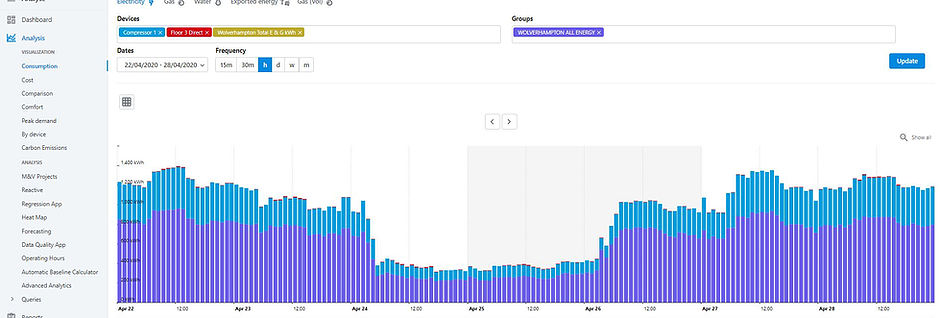
Analysis1
Flexible visualistaion of meter profiles. Easily added to custom reports or Excel.
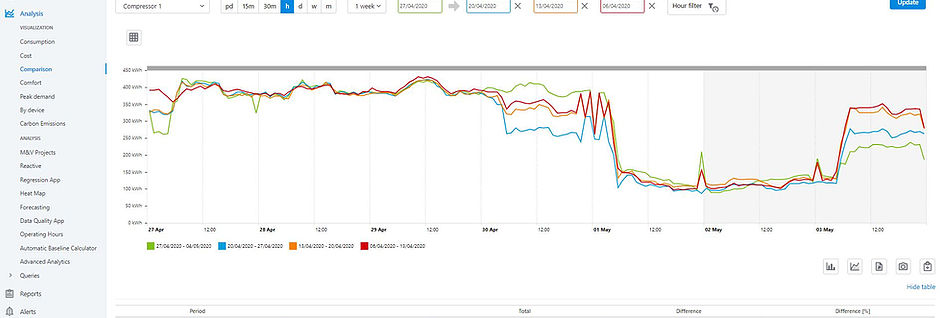
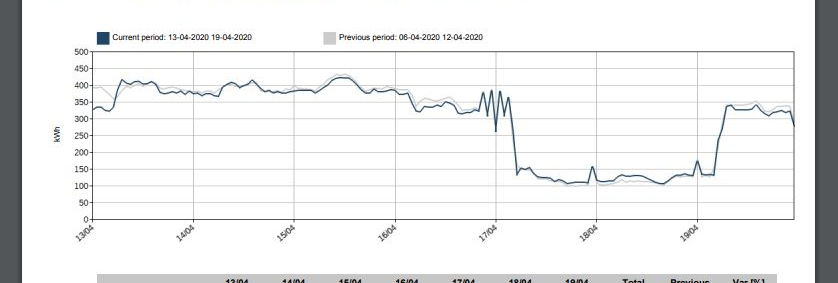
Comparisons
Compare meters over time to find performance variations.
Standard Reporting
Standard templates for reports. These can be easily automated and emailed to users.
Custom Reports
Create custom reports from any content. Auto create and email to users.
Project Tracking
Manage and visualise project performance. Track savings and reduction.
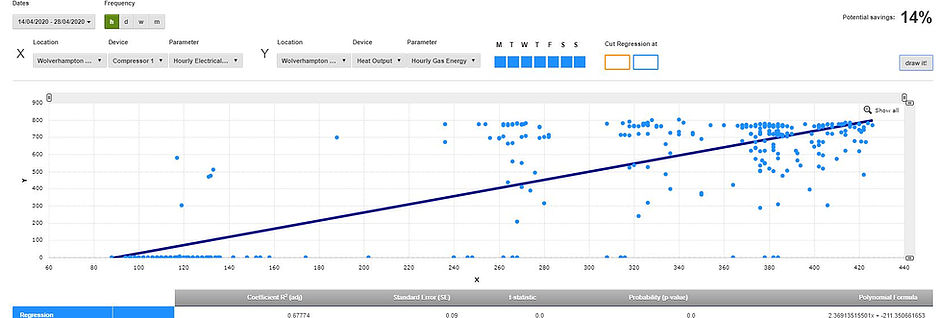
Regression
Various reporting tools including regression, heat maps, cost etc.
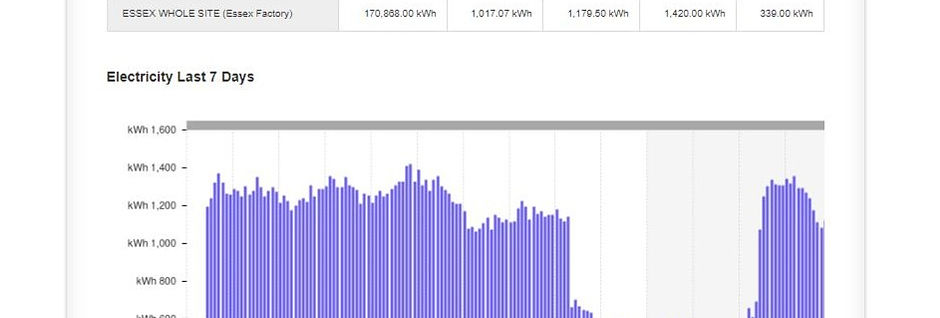
Analysis & Graphing
Flexible tools to view and analyse energy data. Graphical and tabular reports.
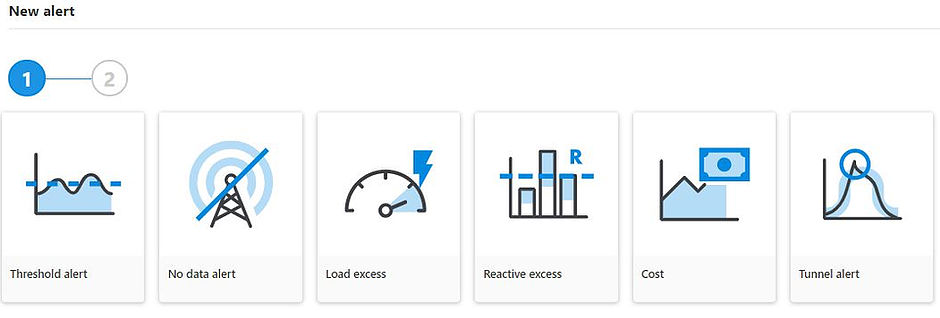
Alarms & Alerts
Automated alerts for anomaly tracking. Automated emails to multiple users.
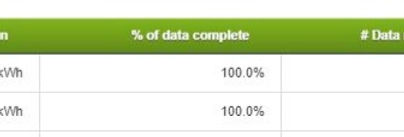
Data Quality
Tools to track and manage data completeness . Automated reports and alerts.
Flexible Data Collection
Providing back-end bureau services to ensure your metering and systems are operating as designed.