
Elcomponent Energy Management Software MeterRing MM Saves £35,000PA, a 50% improvement in energy efficiency
The brief
Built in 2005, the cutting edge architecture of the 3 West North building - part of the Department of Physics - reflects the university's commitment to providing the very highest quality of teaching and research accommodation. Encompassing hi-tech fabrication facilities, laboratories, classrooms and a 200 seat lecture theatre, the building also had to balance intensive energy use with the lowest possible running costs and carbon footprint.
Being Highly Pro-active With Energy Management
Accurate and detailed energy measurement is key to ensuring best practice in terms of energy efficiency, and in this arena Bath University has been highly pro-active. The entire campus is metered by an Elcomponent 'MeterRing MM' automatic sub-metering system, which provides around 1000 data streams on every aspect of energy usage and carbon equivalency on a site-wide basis. The system was of course specified for 3 West North and aggregated meter readings showed that the building was consuming electricity at a rate of some £70K+ per annum.
Combining the data with a coherent action plan is essential if energy savings are to be realised and maintained, and in this instance the plan was the university's 'Big Energy Challenge' which involves the appointment of an 'Energy Champion' for the building. This role is a challenging one as it requires detailed knowledge of the department and processes to enable an effective action plan for energy efficiency to be produced. The energy management plan was created in conjunction with senior departmental staff and the university's energy experts, and defined energy reduction measures which did not present a risk to the integrity of research projects and other critical loads, but still had the ability deliver worthwhile savings, and ultimately an energy efficient building.
The Results
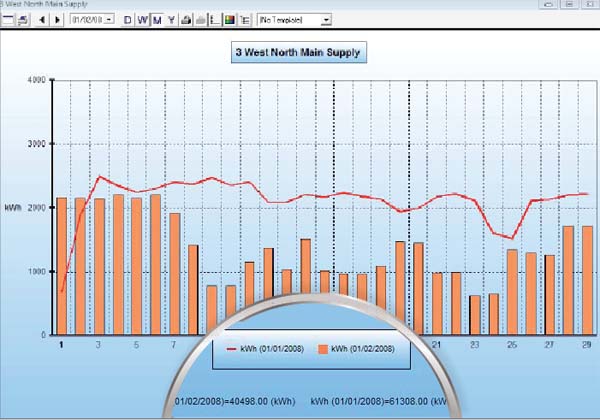
Bath University's Energy Engineer Phil Auger reports that this was achieved in some style at this location as can be seen from the chart adjacent. The red trace shows the monthly consumption at the start of the project with the orange bar chart demonstrating the energy usage in the month following implementation of the new regime. The difference amounts to some £35,000 per annum - about 50% - not to mention a whopping 160 tonnes of CO2, which is a very impressive reduction in the buildings carbon footprint!